
Diversity and Superpower
Our learnings from implementing a data-led approach to diversity and inclusion
Last month we celebrated receiving our Investors in Diversity award which recognises the long way we have come in our diversity and inclusion journey.
But to take our journey to the next stage, we need to tackle a thorny issue: data. Without seeing the real impact of our work on the numbers that matter, we can’t truly know we are making a difference.
In this period of digital transformation, data has been used to leverage insights in all areas of business. The volume of data being collected is growing, and diversity and inclusion is no different. But to truly untap its value, we need to learn how to use it.
A recent article in Forbes magazine argued “data should be used as a superpower by leaders who decide to do something about what it shows them.” So what did we learn when we put on our cape?
Why we invested in our Diversity and Inclusion data analysis
Most organisations capture diversity and inclusion data to some extent. But what do we actually do with it? For Firstport for many years, the answer in all honesty was not much.
As a small charity, we didn’t have any in-house data experts. If you had a question about diversity, you had to find the data to answer it (if it was captured it at all), create a report and cleanse the data before you even got to the numbers containing your answer.
As we embarked on our diversity and inclusion journey, things began to change. We designed a Theory of Change for our diversity work meaning we knew what strategic priorities, outcomes and KPIs we were working towards and could build reports for each. And I developed an outcome tracker in Excel so we had all the data in one place.
Even so, it still wasn’t easy to draw conclusions. The data was static and if you wanted to dig deeper into any area, you had to head back to the database. We knew we wanted something interactive, visual and accessible, but we didn’t know how to build something that matched our ambitions.
How we built our Diversity and Inclusion Dashboard
So late last year, we approached the Scottish Tech Army and were matched with a team of graduates from Merkle EMEA. They generously donated their time and skills for two weeks to deliver us a bespoke Diversity and Inclusion dashboard which we could use to track our performance, make real-time decisions and ultimately help us achieve our ambitions for diversity and inclusion.
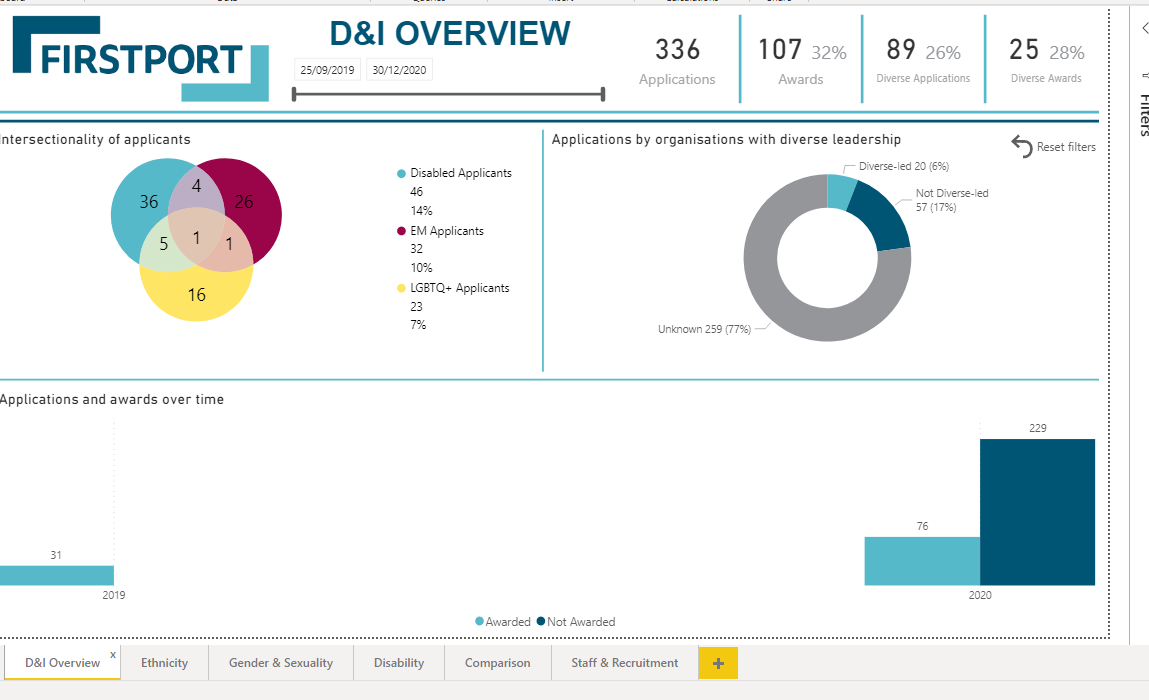
We are delighted with the result. Built on Power BI (the tool comes free with Microsoft 365), the dashboard pulls together different data sources to show results that can be easily manipulated according to what timeframe, programme or outcome we are looking at. This will enable us as teams to ask questions and get answers quickly, empowering us to better incorporate diversity and inclusion data into our day to day decision making.
What we found
The Dashboard already shows us that there is so much more we can draw from the data we have.
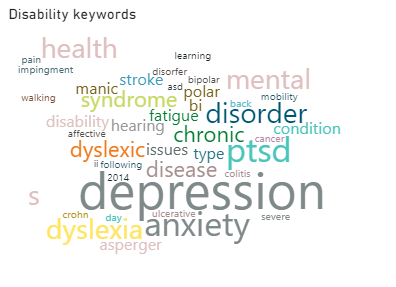
For example, we already knew that 14% of our applicants identified a disabled. But by analysing the language people use to describe their disabilities, the dashboard shows that mental health is by far the biggest issue among our clients.
The dashboard also enabled us to examine issues around intersectionality. Before, there was no easy way to analyse how different applicants with different characteristics related to one another. Now we can see for example that almost a third of our LGBTQI+ applicants also identify as disabled.
There are many more insights to be found in this data. But these early findings are already making us think about our outreach, staff training as well as how we design more inclusive application and assessment processes in the future.
Our Learnings from the Process
It hasn’t all been plain sailing and the journey has come with some unforeseen challenges.
Improvements in how we capture data now compared to the past have resulted in some anomalies and gaps. For example, we started tracking sexuality for the first time and changed how we record disability. These changes, while necessary, mean it has been difficult to compare changes over time.
We also learnt some of our systems are not fit for scale. Our survey data needs manually formatted which is resource intensive and open to error. We discovered alternatives like Google Forms provide formatted data ready to use.
These challenges couldn’t have been avoided but by investing time now to improve the backend of how we work, we can hopefully make data analysis easier, quicker and more accurate – and minimise headaches in the future.
Our next steps
While we are over the moon with our shiny new tool, we know the hard work starts here.
The dashboard and how we use it will need to be tested, refined and updated. We are still exploring how we can support each other to regularly interrogate the data. We don’t want it to sit unused between quarterly reports.
We also know that the dashboard only captures part of the picture. Many people don’t feel comfortable self-reporting sensitive data in surveys. And there are characteristics that don’t appear in our dashboard analysis – like religion, education, class, geography, and income – which might also influence people’s opportunities at Firstport.
We also want to understand how we can share our data better, so we can be transparent in our progress and accountable for our actions.
With all this work still to do, we may also need to think about investing in our data capacity through training, new roles or other partnerships. The potential of data is huge, but won’t always come for free.
Applying business intelligence tools to diversity and inclusion is not a quick fix. But the outcome has been invaluable, providing an opportunity for everyone at Firstport to get under the hood of what we do and to understand with more accuracy the impact we are having on the diverse communities we serve.
We hope tools like this will empower everyone at Firstport to become a champion for diversity and inclusion, to do the work and help shift the numbers…and to use our superpower for good.
Thank you to the team at Scottish Tech Army and Merkle EMEA for their support.